
Digital Factories Quality Control: Which Data Points Matter Most on the Shop Floor?




Digital Factories Quality Control: Which Data Points Matter Most on the Shop Floor?
In digital factories quality control, more data does not automatically mean better control.
The real challenge is knowing which shop-floor signals actually predict defects, stoppages, and safety exposure.
That matters because many factories already collect machine logs, operator inputs, and inspection records.
Yet only a smaller set of data points consistently supports faster decisions and tighter process control.
For industrial assembly, welding, and precision measurement environments, the highest-value metrics usually sit close to the process itself.
They show whether the line is drifting before scrap rises or an incident occurs.
From a standards and execution perspective, digital factories quality control works best when data is timely, actionable, and tied to root causes.
Why Data Selection Matters More Than Data Volume
A common mistake is tracking dozens of KPIs with weak operational value.
That creates dashboards people admire but rarely use during production pressure.
In practical digital factories quality control, the best data points answer three simple questions.
- Is the process stable right now?
- Is product quality drifting out of tolerance?
- Is safety or compliance risk increasing?
If a metric cannot support one of those decisions, it belongs lower on the priority list.
This is where mature intelligence practices, such as those followed by GPTWM, become useful. They connect process data with equipment behavior, metrology discipline, and operational economics.
The Core Data Points That Matter Most
1. First-pass yield
First-pass yield is one of the clearest indicators in digital factories quality control.
It shows how many units pass without rework, repair, or retesting.
When first-pass yield drops, process variation is already affecting output quality.
For welding cells, assembly stations, and torque-critical operations, this metric is often more revealing than total production volume.
2. Process capability and tolerance drift
Cp and Cpk values remain fundamental in technical quality analysis.
They show whether a process can repeatedly stay inside specification limits.
However, the more immediate shop-floor signal is tolerance drift over time.
If measured values slowly move toward the upper or lower limit, intervention should happen before actual nonconformance appears.
3. Measurement system performance
Digital factories quality control depends on trusted measurement data.
If gauges, sensors, or vision systems are unstable, every downstream decision becomes weaker.
Key signals include gauge repeatability, calibration status, bias trends, and sensor fault frequency.
In metrology-heavy environments, bad measurement discipline often looks like a production problem at first.
4. Machine parameter stability
Machine settings drive much of product consistency.
Useful data points include cycle time variation, spindle load, vibration, temperature, pressure, speed, and energy profile.
For welding, current, voltage, wire feed rate, and heat input stability often matter even more.
The stronger signal is not the target setting alone, but deviation from the normal operating band.
5. Defect type and defect location
Counting total defects is useful, but not enough.
High-value digital factories quality control breaks defects down by type, station, shift, material lot, and tool used.
That level of detail helps separate isolated mistakes from systemic process failures.
A porosity cluster at one welding station tells a very different story than random scratches across final assembly.
The Safety and Compliance Signals That Cannot Be Ignored
Quality and safety data are often managed separately, but that split creates blind spots.
In real shop-floor conditions, process instability can quickly become a safety issue.
The most important safety-related data points include:
- Near-miss frequency by area and task
- Lockout-tagout deviations
- PPE compliance rate
- Fume, heat, or noise exposure trends
- Manual torque or assembly force exceptions
- Alarm overrides and unauthorized setting changes
These are not side metrics. They are core signals in digital factories quality control.
A repeated bypass of safety interlocks can also indicate production pressure, poor workstation design, or unstable equipment.
That also means compliance data should be visible alongside quality performance, not buried in separate monthly reports.
What Data Works Best for Root Cause Analysis
Not every data point helps explain why a failure happened.
The strongest root cause combinations usually link process, people, material, and time.
The most practical data stack often includes:
This kind of structure makes digital factories quality control more predictive and less reactive.
How to Prioritize Data on a Busy Shop Floor
The best approach is to rank data by decision value, not by ease of collection.
In actual operations, four layers usually work well.
Tier 1: Live control signals
These include alarms, parameter deviations, critical dimensions, and safety interlock events.
They support immediate action during production.
Tier 2: Shift-level performance signals
These include first-pass yield, defect concentration, downtime cause, and rework rate.
They guide supervisor decisions and short-interval review meetings.
Tier 3: Trend and capability signals
These include Cpk, calibration drift, maintenance frequency, and recurring fault patterns.
They help engineering teams redesign controls and reduce chronic variation.
Tier 4: Strategic intelligence signals
These include supplier shifts, regulatory updates, export restrictions, and technology adoption trends.
This broader layer aligns with how GPTWM frames the last mile of manufacturing performance through precision-focused intelligence.
Common Mistakes in Digital Factories Quality Control
- Tracking output volume while ignoring variation inside the cycle
- Relying on final inspection instead of process monitoring
- Using unverified sensor data for quality decisions
- Separating quality metrics from safety metrics
- Reviewing data too late to prevent scrap or incidents
- Collecting data without clear escalation rules
The more obvious signal is this: if a metric never changes a decision, it should be questioned.
Digital factories quality control should simplify action, not add reporting burden.
A Practical Starting Framework
A strong starting set for most factories is small and disciplined.
- Track first-pass yield by station and shift.
- Monitor critical dimensions against control limits in real time.
- Capture machine parameter deviations with timestamps.
- Link defects to material lot, tool ID, and operator context.
- Include near-miss and alarm override data in daily reviews.
- Validate measurement systems on a fixed schedule.
That framework creates a practical base for digital factories quality control without overwhelming the floor.
It also supports better decisions on training, maintenance, tooling, and compliance response.
In the end, the most important data points are the ones closest to process truth.
When those signals are visible, trusted, and tied to action, digital factories quality control becomes a real operating advantage instead of a reporting exercise.
Related News
Selecting Adjustable Torque Tools for Repeatable Fastener Assembly
Adjustable torque tools: learn how to match range, accuracy, control methods, calibration, and ergonomics for repeatable, reliable fastener assembly.
How to Select Aerospace Inspection Tools for Aircraft Maintenance Tasks
Aerospace maintenance inspection tools: learn how to select reliable, traceable equipment for aircraft access, accuracy, calibration, and compliant maintenance decisions.
How to Select Wire Bonding Tools for Fine-Pitch Semiconductor Packaging
Explore semiconductor manufacturing tools for wire bonding and learn how to select precision solutions for fine-pitch packaging, reliable loops, accuracy, and yield.
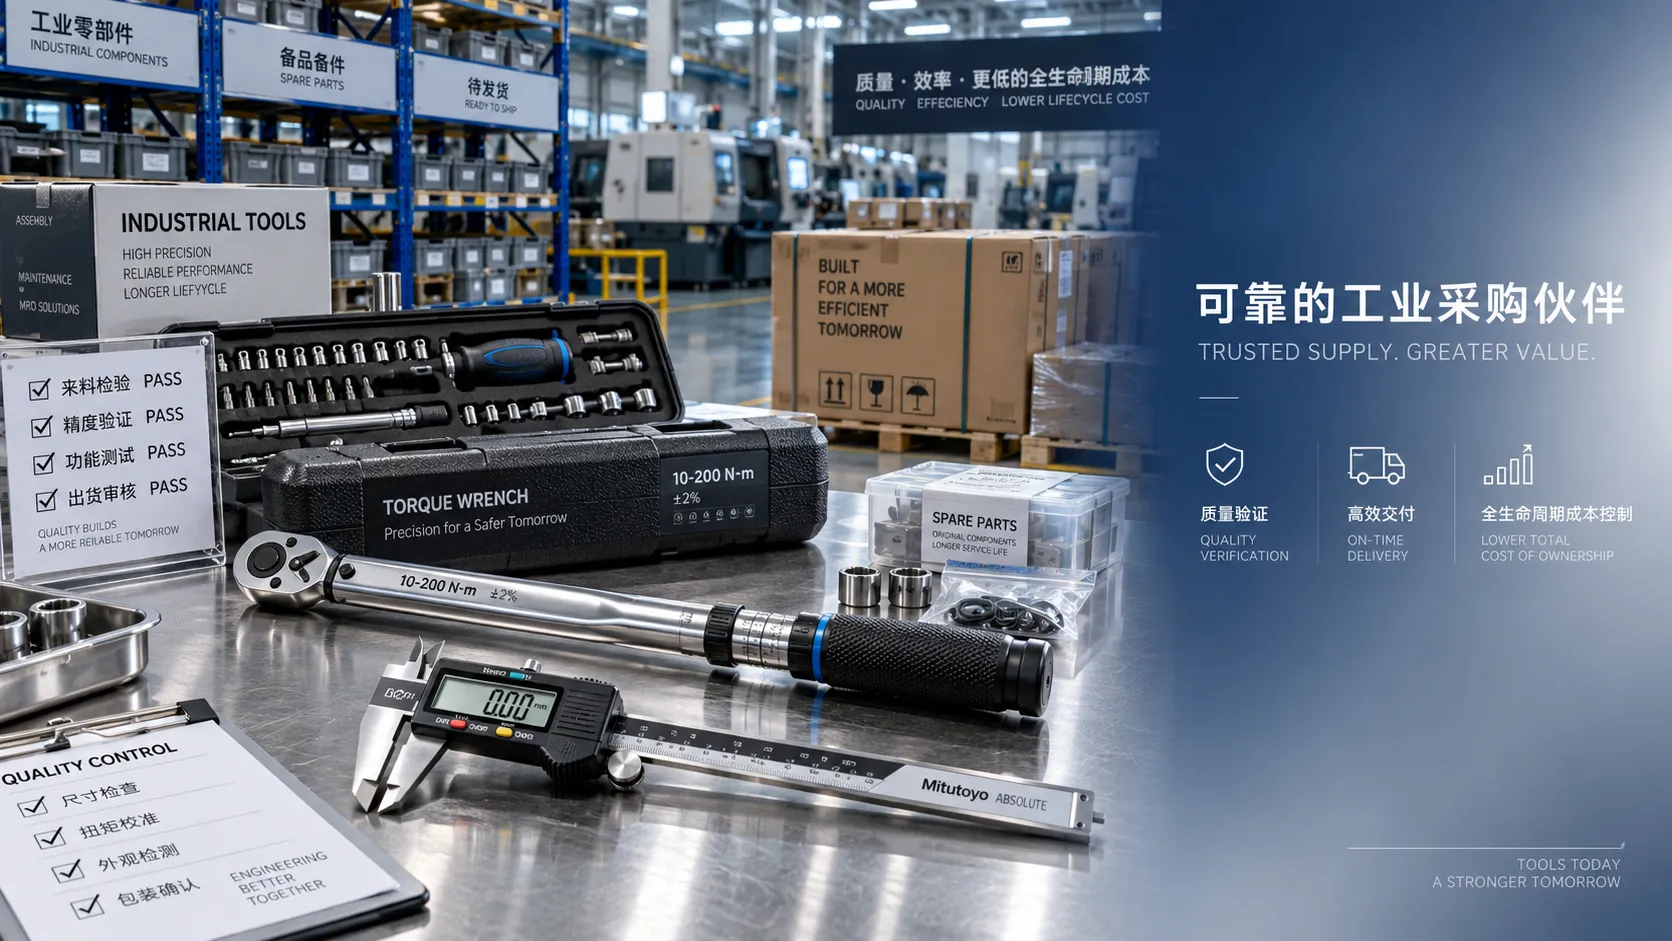
How to Compare Industrial Tool Suppliers for Quality, Lead Time, and Total Cost
Industrial tool selection supplier comparison made simple: evaluate quality, lead times, total cost, service, and supply resilience for confident sourcing decisions.
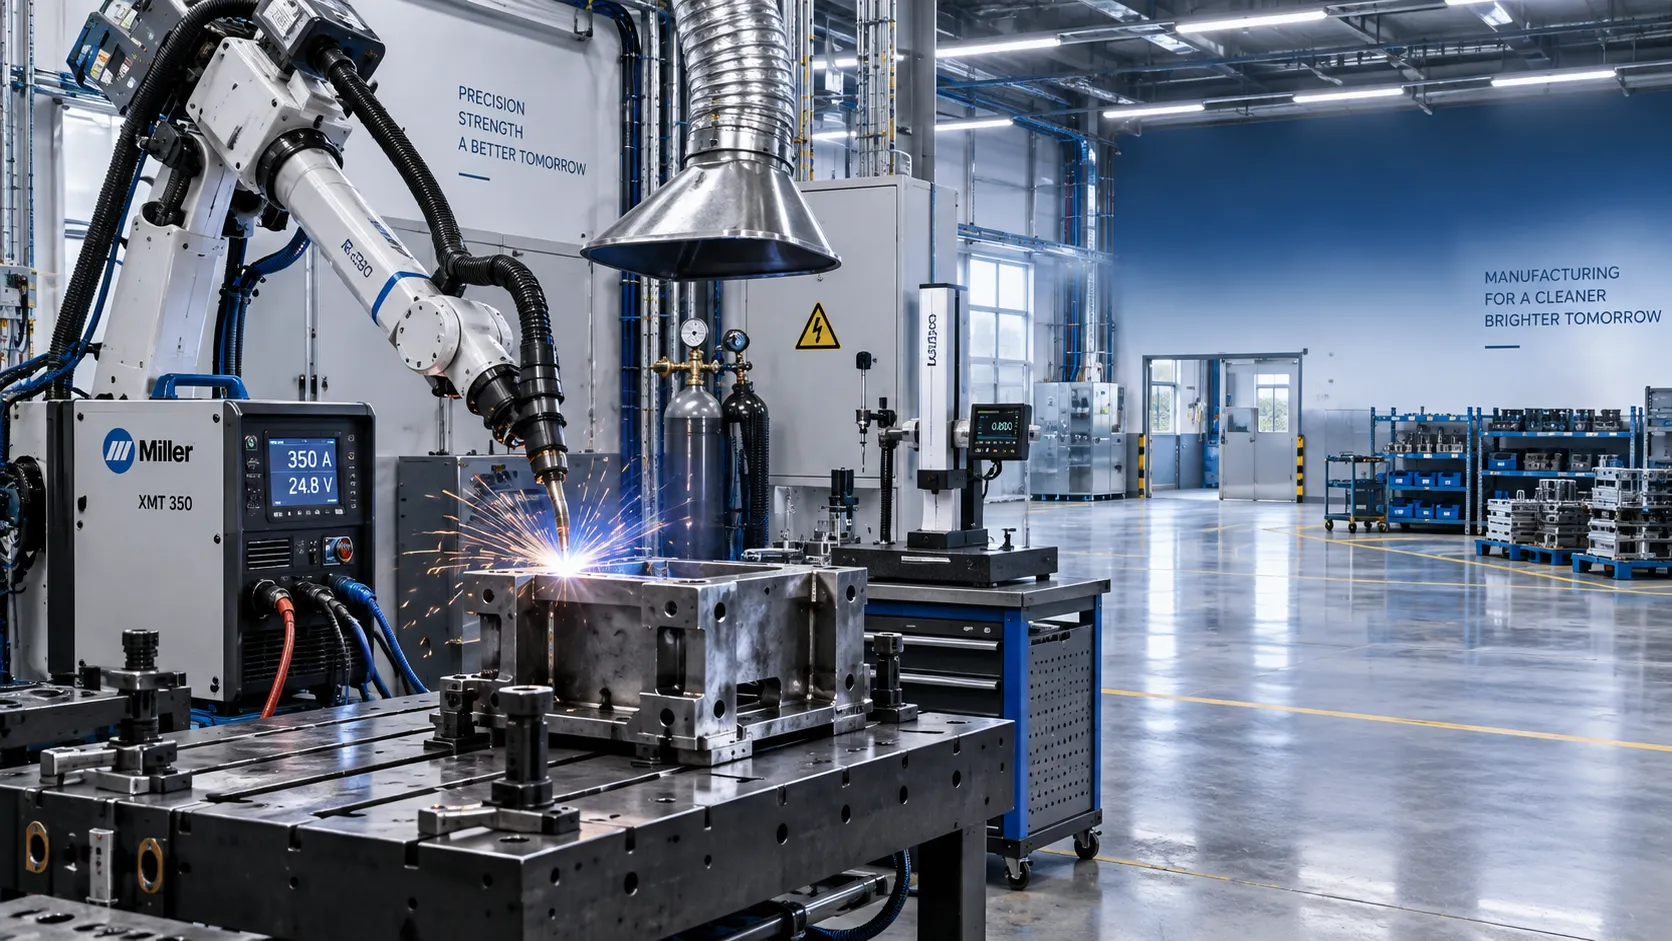
Industrial Equipment Application Guidance: Match Machines to Operating Conditions
Application guidance industrial equipment: match capacity, duty cycle, materials, site conditions, safety, and lifecycle cost to improve reliable output. Read the guide.
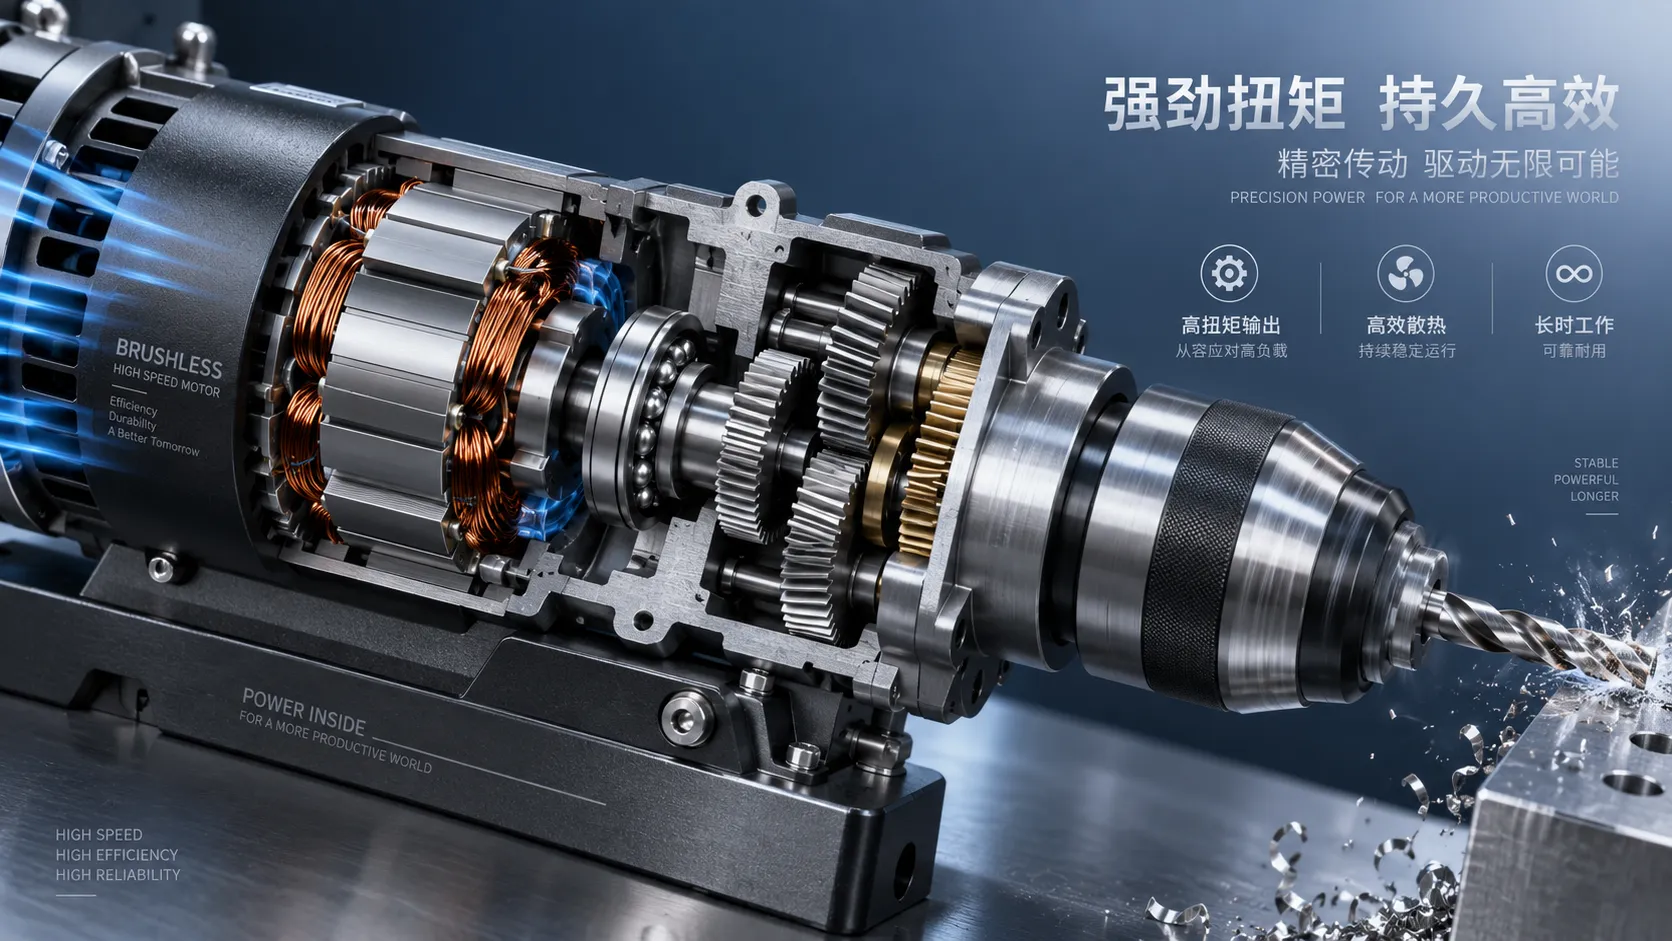
Selecting High-Speed Brushless Tool Motors for Torque, Heat, and Duty Cycle
High speed brushless tool motors: learn how to balance torque, heat, gearing, and duty cycle for reliable industrial tool performance and longer service life.
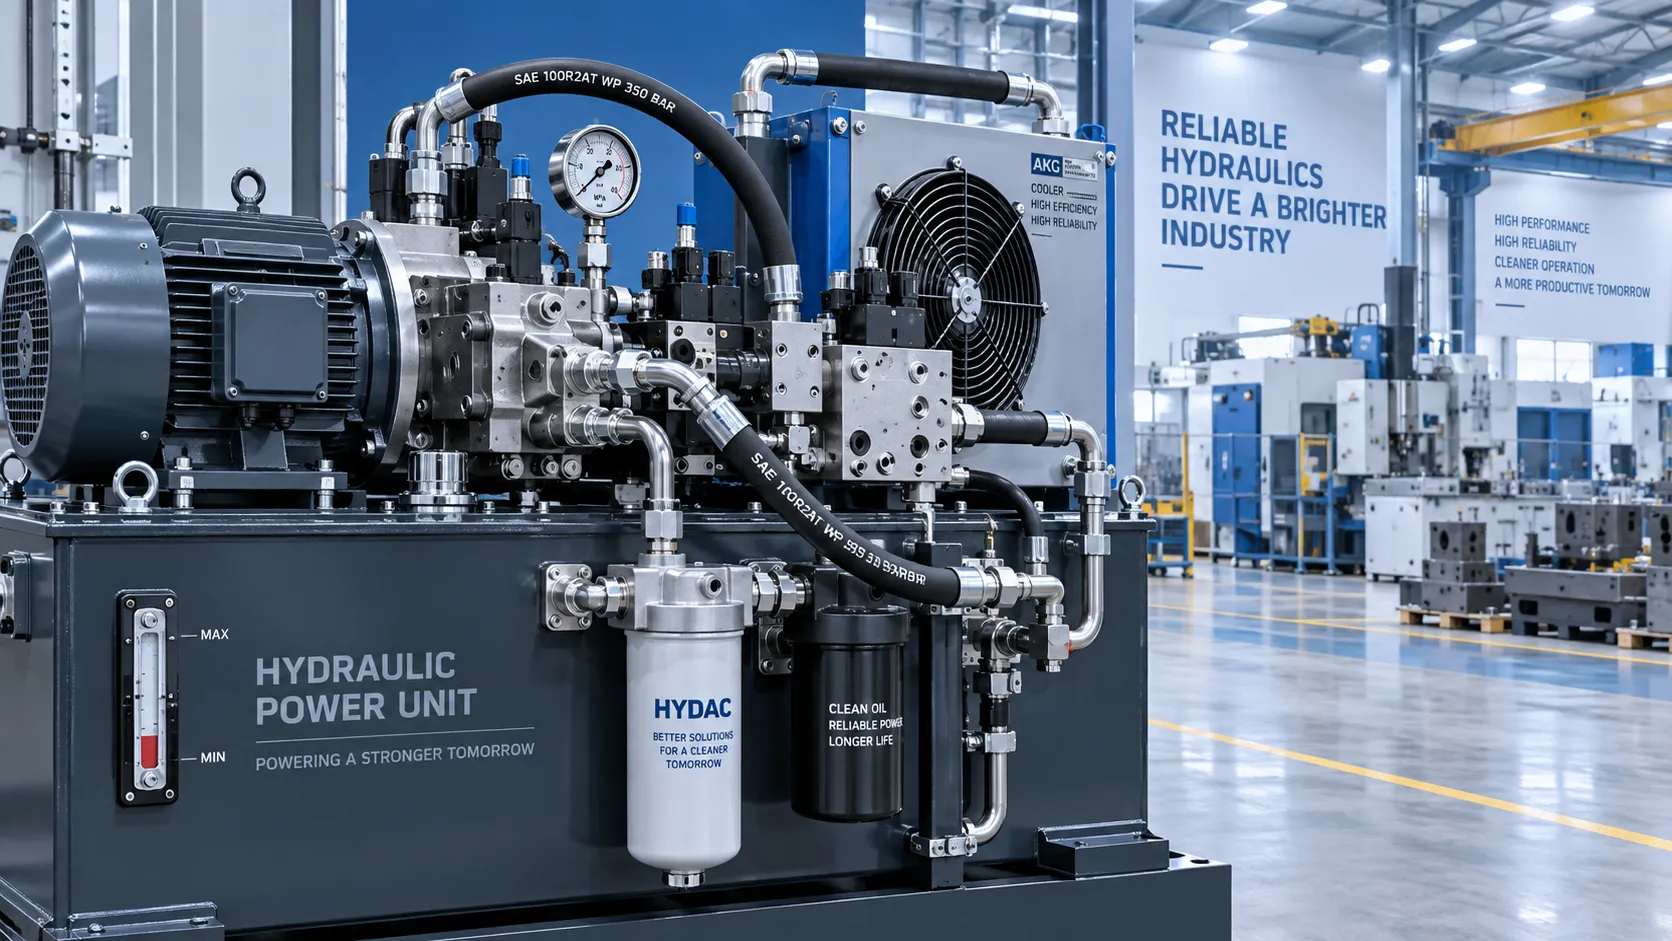
What Determines Industrial Hydraulic System Price for Heavy-Duty Equipment?
Industrial hydraulic system price depends on duty cycle, pressure, components, cooling, and integration. Compare quotes intelligently to secure reliable heavy-duty performance.
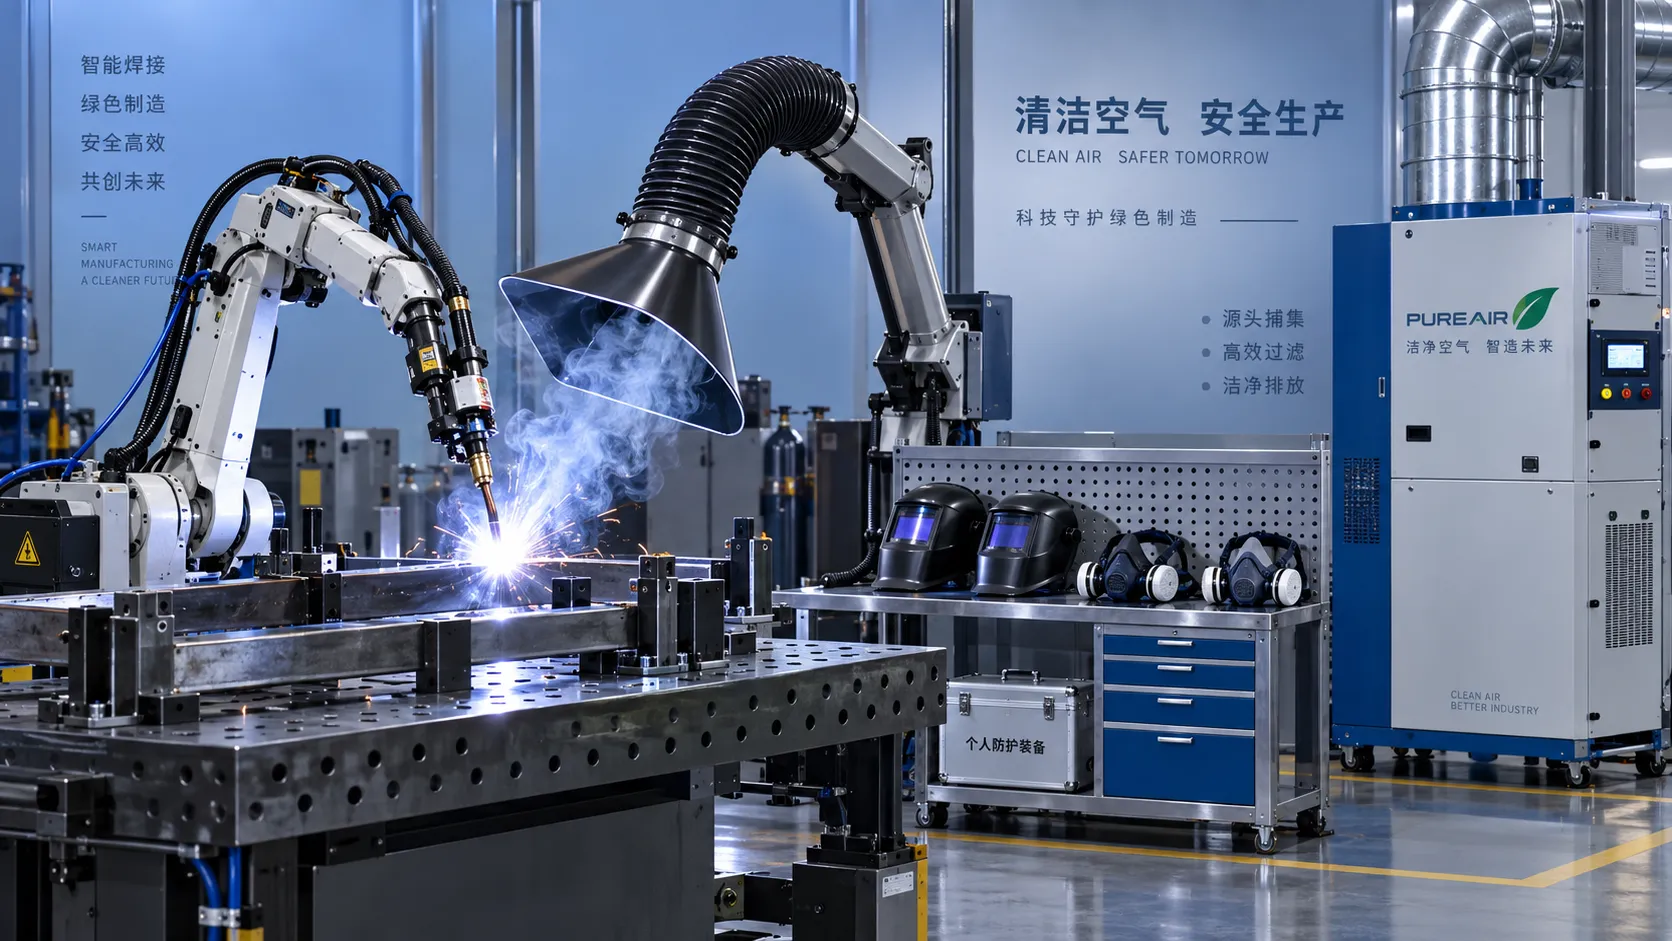
Welding Fume Extraction PPE: When Respirators Are Not Enough for Shop Safety
Welding fume extraction PPE: learn why respirators alone fall short and how source capture, ventilation, and layered controls improve shop safety.
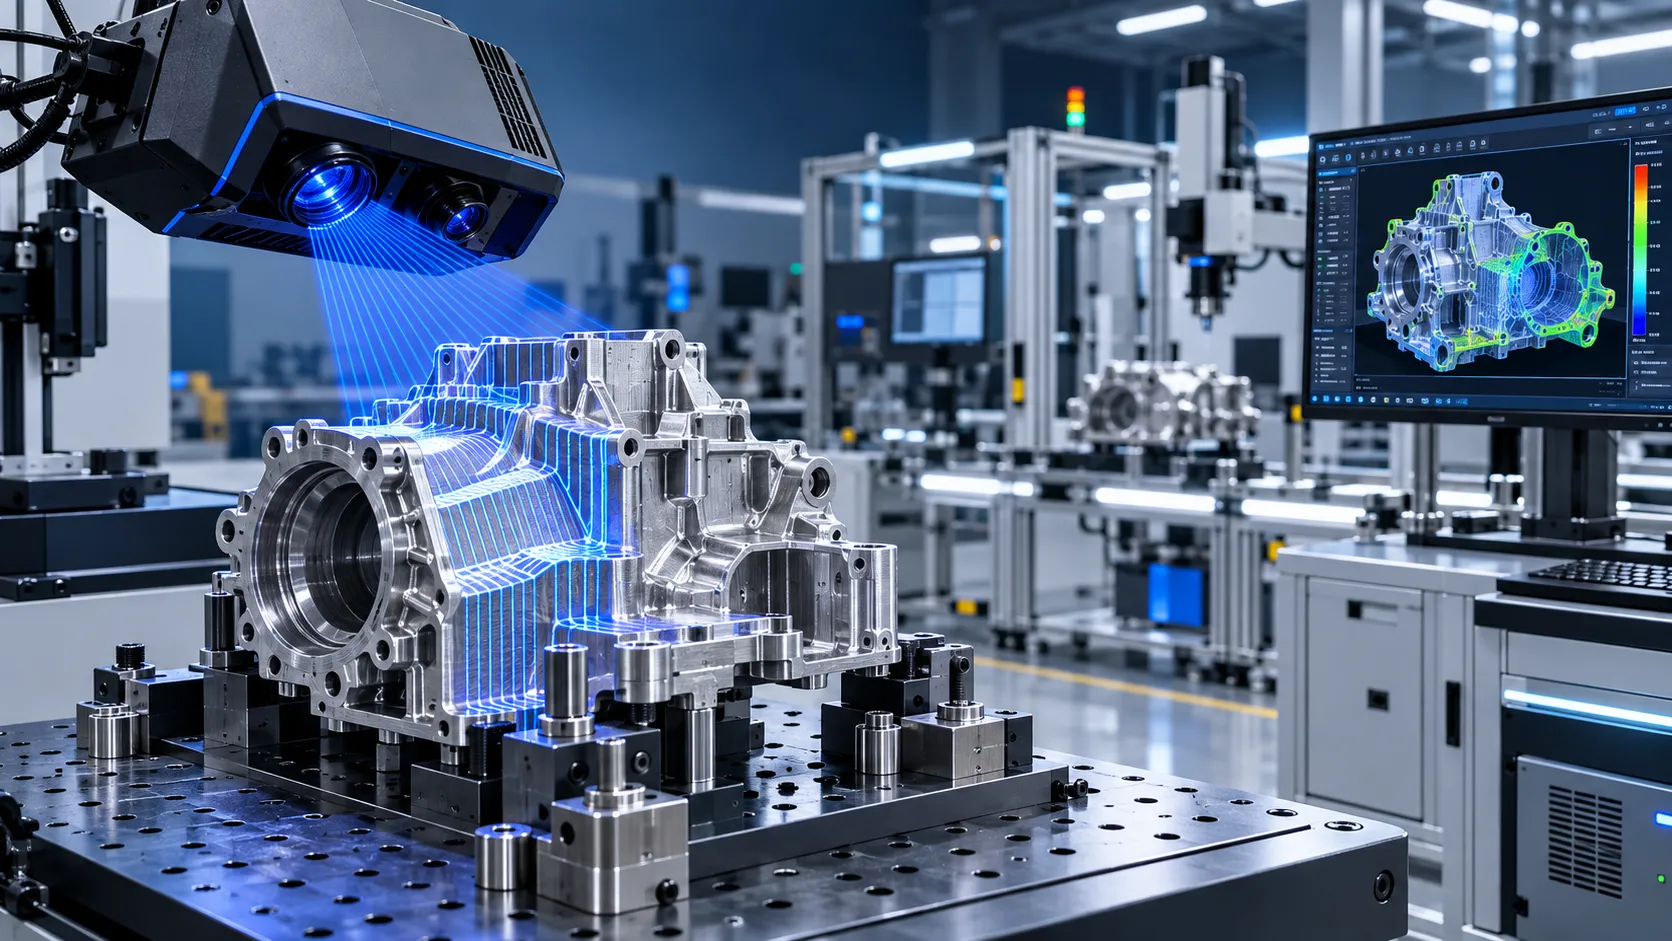
How to Select Optical Metrology Solutions for Tight-Tolerance Manufacturing
Optical industrial metrology solutions for tight-tolerance manufacturing: evaluate accuracy, surface compatibility, workflow, and traceability to select with confidence.
Related News
- 00
0000-00
Selecting Adjustable Torque Tools for Repeatable Fastener Assembly - 00
0000-00
How to Select Aerospace Inspection Tools for Aircraft Maintenance Tasks - 00
0000-00
How to Select Wire Bonding Tools for Fine-Pitch Semiconductor Packaging - 00
0000-00
Industrial Equipment Application Guidance: Match Machines to Operating Conditions - 00
0000-00
Selecting High-Speed Brushless Tool Motors for Torque, Heat, and Duty Cycle
Prof. Marcus Chen
Weekly Insights
Stay ahead with our curated technology reports delivered every Monday.